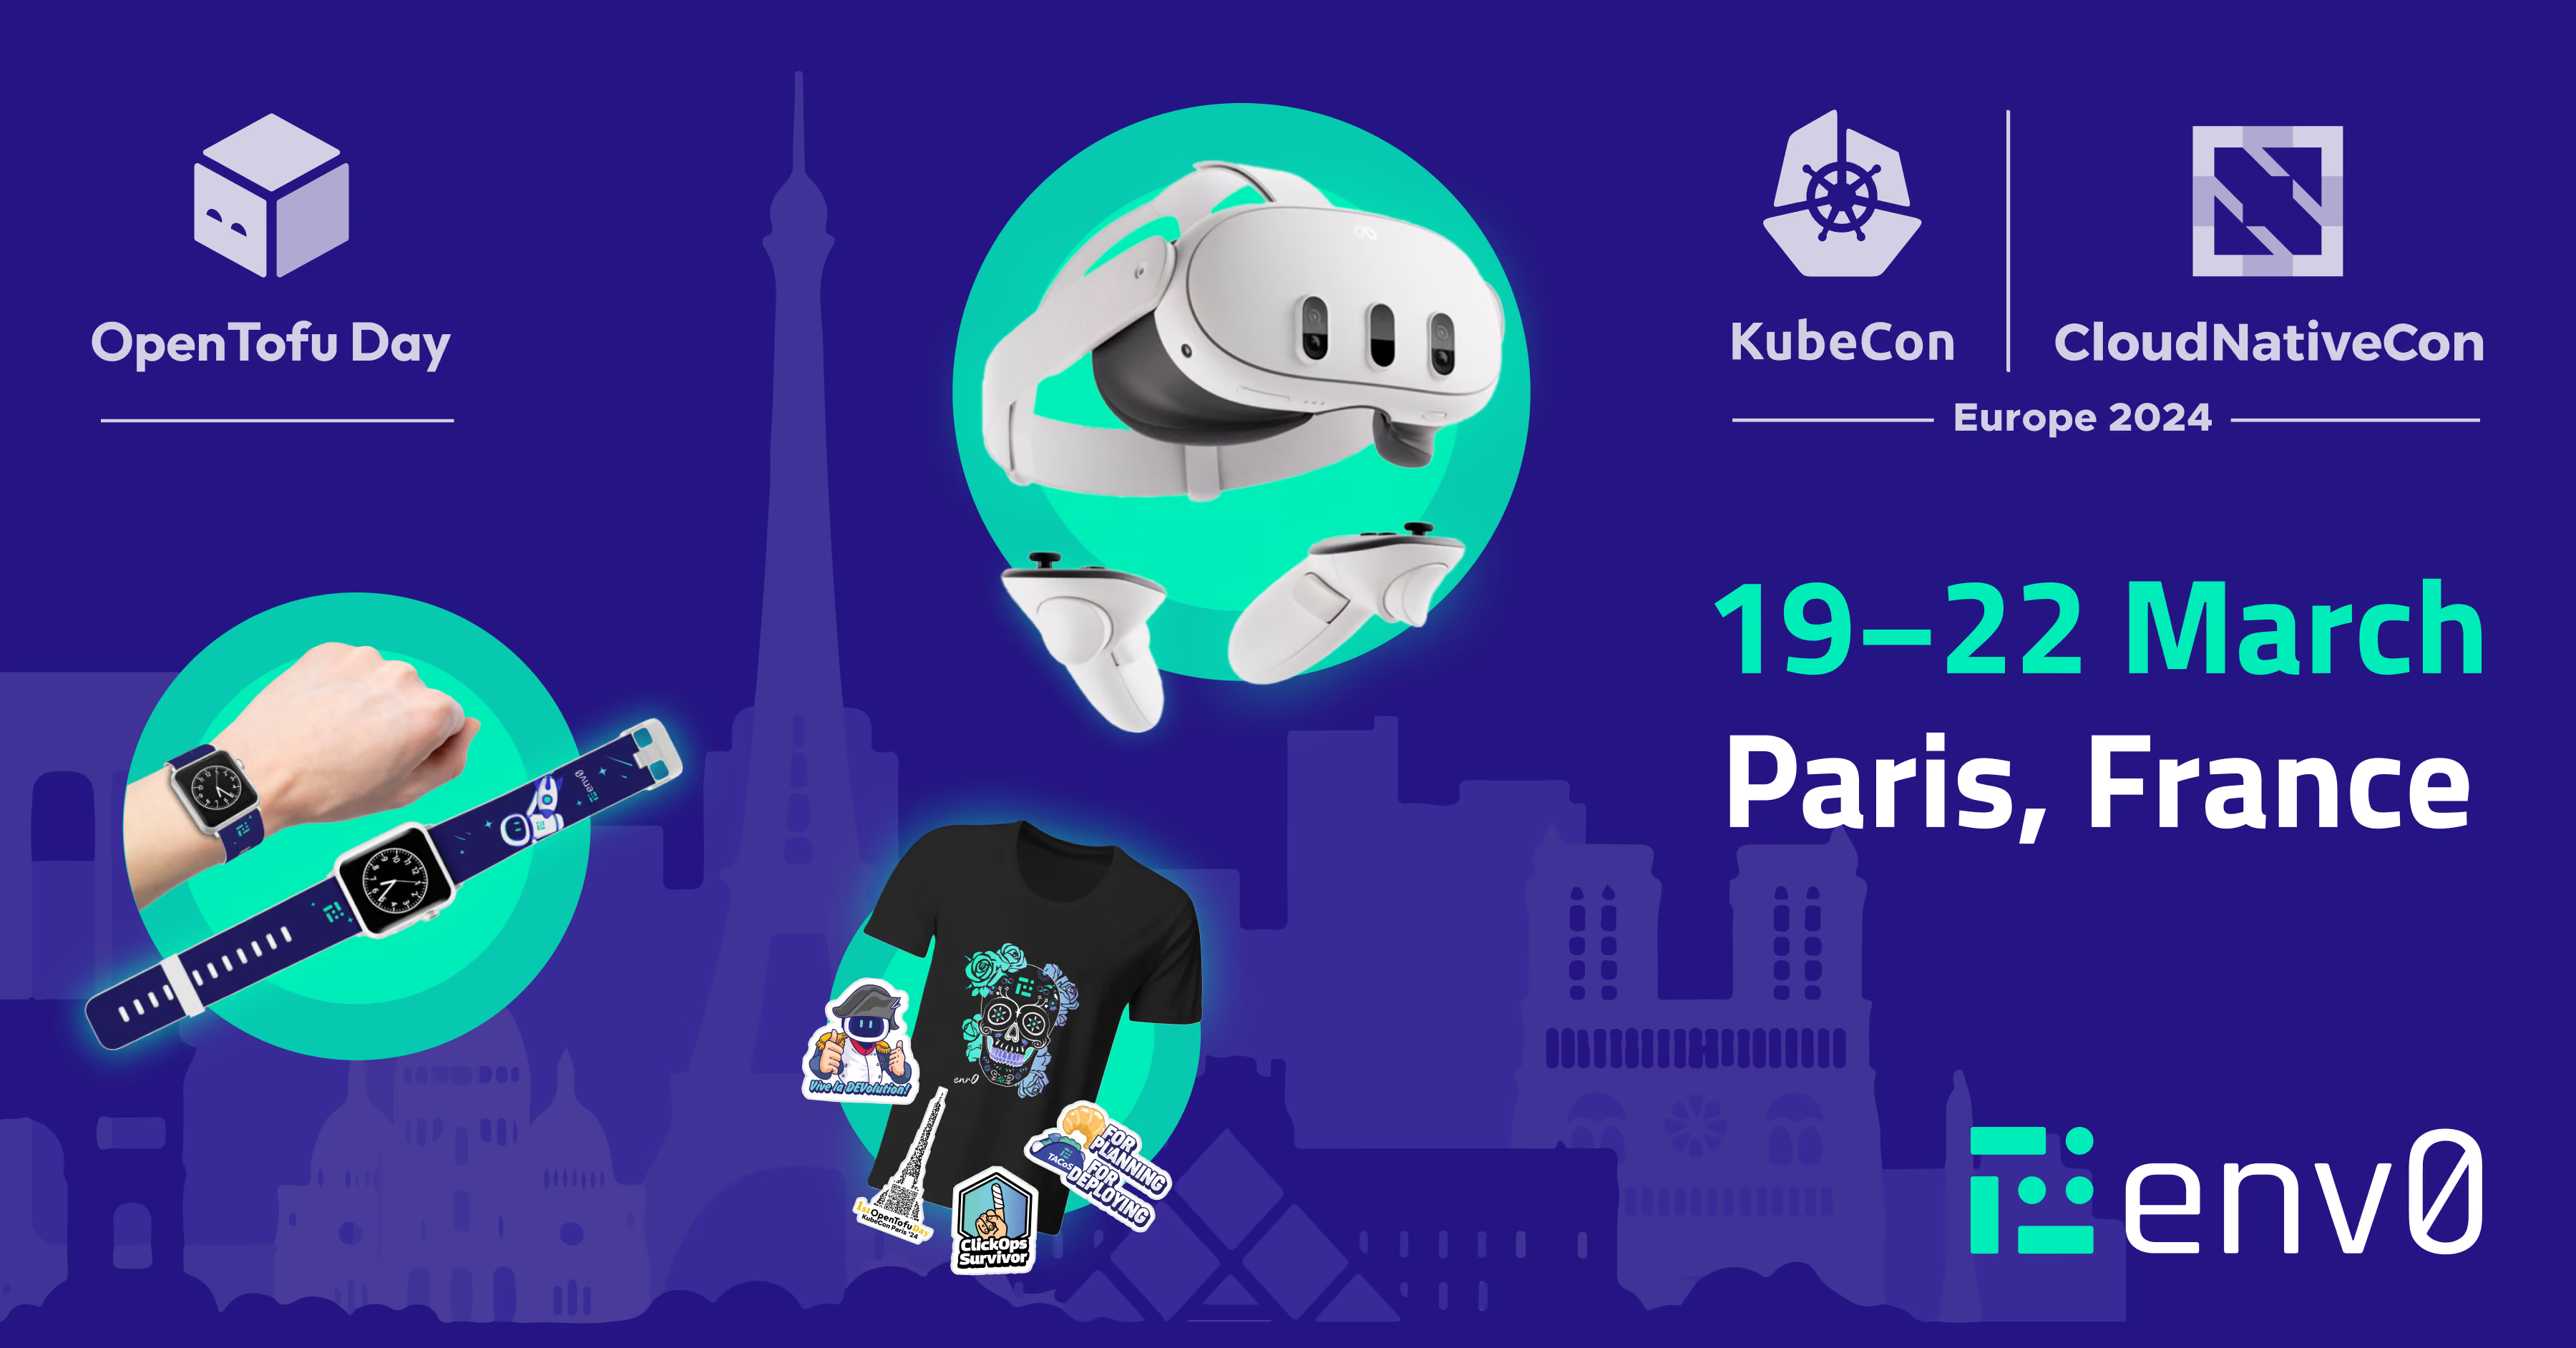
KubeCon Europe, the flagship CNCF dev conference, is heading to Paris from March 19-22 at the Porte de Versailles expo.
The envzero team will be there in full force, and as usual, we're excited to connect with the amazing cloud-native engineering community.
If there, be sure to swing by booth L12 to discover our latest platform features, pick up some swag, and participate in our Meta Quest 3 raffle.
We also invite you to join us for the talks and panels we'll be hosting this year, both on KubeCon's main stage and at the inaugural OpenTofu Day event. More on that below.
📅 Lastly, if you'd like to talk shop, schedule a meeting using this link and you'll have the chance to win an Apple Watch as a 'thanks-for-helping-us-plan-ahead' gift.

Make Note: Visit us at Booth L12
Drop by our booth to meet the members of the OpenTofu founding team and discuss the project, its progress, and the road ahead.
While there, make sure to explore some of our newest capabilities, such as the Environment Discovery feature. With it, you can effortlessly create, plan, deploy, and destroy environments by simply creating pull requests within a preconfigured directory structure.
Also, don't forget to check out the awesome swag we've prepared for you this year, including limited edition T-shirts, unique KubeCon Paris stickers, and some exciting OpenTofu stuff we keep as a surprise for now.
And of course, take a moment to register for our raffle for a chance to win a brand new Meta Quest 3!

First-of-many OpenTofu Day
OpenTofu, the open-source Terraform alternative (obviously), holds a special place in our hearts.
That's why we're thrilled about the first-of-many OpenTofu Day, hosted by CNCF, on March 19th.
Join us for an exclusive opportunity to dive deep into the OpenTofu community, gain behind-the-scenes insights, and discover real-world use cases from companies that have already made the switch.
During the day we will participate in the following events:
| OpenTofu Registry: The Low-Maintenance & Highly-Available Open Source SaaS |
|---|
9:50 - 10:15, Level 7.3, Room E05 - E06 |
| OpenTofu Power Users Panel |
|---|
11:40 - 12:15, Level 7.3, Room E05 - E06 |
IaC Experts Panel
Our CEO Ohad Maislish will be part of the panel discussion taking place on March 21st. It promised to be an engaging conversation.
To tune in, you can find the details listed below:
| The IaC Evolution, On Open Source and Everything Else |
|---|
11:55 - 12:30 CET, Level 7.3, Room S04 |
See you soon in the city of lights!
Related Content

When it comes to deploying applications in Kubernetes, it's like having your own Swiss Army knife; you've got a tool for every task. That's where Terraform and Helm come into play, joining Kubernetes to form a mighty trio that can tackle both infrastructure provisioning and application deployment with finesse.
In this post, I’ll demonstrate how these three tools come together, using env zero to create a unified platform that combines Kubernetes scalability with Terraform's provisioning strength and Helm's deployment dexterity.
Terraform, Kubernetes, and Helm: Better Together
The advantage of using Terraform, Kubernetes, and Helm together lies in their synergy, with each tool playing it own part:
- Terraform excels at setting up and managing the infrastructure that Kubernetes runs on, especially with services such as AWS EKS.
- Kubernetes provides the orchestration and management layer for your containerized applications, ensuring they run as intended.
- Helm takes over the application deployment aspect, making it easy to package, deploy, and manage applications in Kubernetes.
Granted, Terraform can deploy applications directly into Kubernetes clusters using its Helm provider, so technically speaking, you can manage both your infrastructure and applications through Terraform scripts.
However, for more effective lifecycle management of applications, it's advisable to keep the responsibilities of infrastructure setup and application deployment distinct, because:
- It aligns with the best practices of modern development, allowing for a clear division of concerns and making it easier to manage changes and updates between teams.
- It establishes a seamless workflow with Terraform, used to automate the creation of Kubernetes clusters, Kubernetes serving as the runtime environment, and Helm working to streamline the deployment process.
- It enables us to use Kubernetes-native tools (in our case, Helm), that are finely tuned to “understand” Kubernetes' architecture, offering the ability to perform rollbacks, conduct easy updates, manage application releases effectively, etc.
How to Streamline Kubernetes Deployments with env0
Requirements
- A GitHub account
- Access to an AWS account
- An env zero account
TLDR: You can find the main repo here.
Note: Terraform can deploy applications directly into Kubernetes clusters using its Helm provider or its Kubernetes provider, so technically speaking, you can manage both your infrastructure and applications through Terraform scripts. However, you will find this tedious and not as efficient, and also not aligned to the k8s best practices I describe below.
Integrating Terraform and Helm with env0
Now let’s jump into a demo in which we’ll use Terraform to provision a managed Kubernetes cluster in AWS (EKS) and then utilize Helm to deploy the Prometheus and Grafana applications, with env zero providing the common workflow for both, like so:

For further reference, below is our repo's folder structure. Notice that we have a folder that contains all of our Terraform configuration files.
├── LICENSE
├── README.md
└── Terraform
├── main.tf
├── modules
│ └── eks
│ ├── LICENSE
│ ├── README.md
│ ├── main.tf
│ ├── outputs.tf
│ ├── variables.tf
│ └── versions.tf
├── outputs.tf
├── terraform.tfstate
├── terraform.tfstate.backup
└── variables.tf
3 directories, 13 files
EKS cluster provisioning with Terraform template
Let's start by creating a new project in env zero and calling it Env0-Kubernetes-Prometheus-Grafana.
Next, create a Terraform template for setting up an EKS cluster. Head over to the Templates tab on the left navigation bar create a new Template of type Terraform and fill out the fields as required.
Select the GitHub Repo and remember to select Terraform in the Terraform Folder field.

You won't need to fill out anything in the variables tab. Finally, add this template to the project.
Make sure to add your AWS credentials in the organization settings and then reference them in the Credentials tab in the Project Settings section.

Now go ahead and create a new environment referencing this newly created template from the Project Environments tab within your Project.
Of course, you will need to approve the Terraform plan before the [.code]terraform apply[.code] could run. This process will take over 20 minutes so grab a coffee while you wait for your cluster, or continue with the Helm templates below.
Application deployment via Helm template
It's now time to create our Helm templates in env zero for both Prometheus and Grafana.
1. Create the Helm templates in env0
Similar to what we did for the Terraform template, do the same for Prometheus first then Grafana.
Note that now we will select the Helm template and under the VCS tab, you will need to reference the Helm Repo and specify the Helm chart repository along with the Helm chart version and chart name as shown below for Prometheus.

And here is what it looks like for Grafana:

Once again, you won't need to fill out any variables. If you need to modify the values file for the helm release you can add Environment variables in env0, but we won't need that for our demo.
Make sure to add these two templates to your project.
2. Add k8s cluster credentials
Once the Environment we created with Terraform is complete and the EKS cluster is created, we can add the Kubernetes credentials as shown below:


Notice that the cluster name needs to match the cluster name we created in EKS and needs to be in the same region. You can read more about this in env0's documentation.

Your project Settings page and the Credentials tab should look like the image above.
3. Use Helm templates to create two environments
Now we can create two more environments in our project using the two Helm templates we created.
This will deploy our Prometheus and Grafana applications. Just make sure to leave the Namespace field empty as shown below and give a name to the release. This will deploy the applications to the default namespace in our Kubernetes cluster.

4. Review project environments
By now you should have three active environments: one from the Terraform template and two from the Helm templates, as shown below.

Also, your organization templates should look like this:

4. Connect the EKS cluster
From the Grafana or the Prometheus environment deployment log, you can find the [.code]aws cli[.code]command to access the cluster:
aws eks update-kubeconfig --name env0_eks_cluster_monitoring --region us-east-1

Let's run some commands from our cli to check on our cluster. Get the nodes:
(⎈|arn:aws:eks:us-east-1:706933696988:cluster/env0_eks_cluster_monitoring:default)
sam@Sam-Office-Desk:~/Development_Linux/customersenv0/env0-kubernetes/Terraform$ kubectl get nodes
NAME STATUS ROLES AGE VERSION
ip-10-0-1-80.ec2.internal Ready [none] 168m v1.27.9-eks-5e0fdde
ip-10-0-3-168.ec2.internal Ready [none] 168m v1.27.9-eks-5e0fdde
Check the running pods. You can see Grafana and Prometheus pods running.
$ kubectl get po
NAME READY STATUS RESTARTS AGE
grafana-9dd4b466b-r5sfx 1/1 Running 0 145m
prometheus-alertmanager-0 1/1 Running 0 146m
prometheus-kube-state-metrics-58bc485699-kvj4t 1/1 Running 0 146m
prometheus-prometheus-node-exporter-jg8np 1/1 Running 0 146m
prometheus-prometheus-node-exporter-jq9p5 1/1 Running 0 146m
prometheus-prometheus-pushgateway-f4557d877-dzf29 1/1 Running 0 146m
prometheus-server-5478d946bc-j2nx6 2/2 Running 0 146m
Check the Helm charts installed.
$ helm ls
NAME NAMESPACE REVISION UPDATED STATUS CHART APP VERSION
grafana default 1 2024-02-08 16:37:43.667592038 +0000 UTC deployed grafana-7.3.0 10.3.1
prometheus default 1 2024-02-08 16:36:32.470600452 +0000 UTC deployed prometheus-25.11.0 v2.49.1
Check the status of the Grafana chart to retrieve the initial admin password.
$ helm status grafana
NAME: grafana
LAST DEPLOYED: Thu Feb 8 16:37:43 2024
NAMESPACE: default
STATUS: deployed
REVISION: 1
NOTES:
1. Get your 'admin' user password by running:
kubectl get secret --namespace default grafana -o jsonpath="{.data.admin-password}" | base64 --decode ; echo
2. The Grafana server can be accessed via port 80 on the following DNS name from within your cluster:
grafana.default.svc.cluster.local
Get the Grafana URL to visit by running these commands in the same shell:
export POD_NAME=$(kubectl get pods --namespace default -l "app.kubernetes.io/name=grafana,app.kubernetes.io/instance=grafana" -o jsonpath="{.items[0].metadata.name}")
kubectl --namespace default port-forward $POD_NAME 3000
3. Login with the password from step 1 and the username: admin
#################################################################################
###### WARNING: Persistence is disabled!!! You will lose your data when #####
###### the Grafana pod is terminated. #####
#################################################################################
Retrieve the password.
$ kubectl get secret --namespace default grafana -o jsonpath="{.data.admin-password}" | base64 --decode ; echo
iyFssztHAvyoXr6w1Q5uDTMxmoDcNr74kbmaPyKZ
Expose port 3000 on your host machine to access the Grafana dashboard.
$ kubectl port-forward svc/grafana 3000:80
Forwarding from 127.0.0.1:3000 -> 3000
Forwarding from [::1]:3000 -> 3000
5. Access the Grafana dashboard
Now let's connect Grafana to Prometheus. First, we'll need to log in. Go to [.code]http://127.0.0.1:3000[.code] in your browser and you'll be greeted with the login page for Grafana:

6. Connect Prometheus as a data source for Grafana
Next, go to the Data sources tab under Connections on the left navigation bar to add Prometheus as a data source for Grafana. Make sure to use the Prometheus server URL of: [.code]http://prometheus-server[.code] then click the Save and Test button at the bottom.

7. Run a query to test
Let's finally run a query in Grafana to see that the application is working. Go to the Explore tab on the left navigation bar and select a metric. I selected [.code]node_memory_Active_file_bytes[.code] as an example. Then hit the blue button at the top right called Run Query. You should get a graph at the bottom showing that our application is working.

Congratulations!! You've just automated the process of creating an EKS cluster with Terraform and deployed a monitoring stack into the cluster using Helm charts. Moreover, this was all done with one platform, env0, that offers the same workflow for infrastructure provisioning and application deployment.
Clean-Up
You can simply destroy the environments in reverse order of how we created them. So go ahead and destroy the Grafana and Prometheus environments, then the Terraform one. That will clean up everything nicely for you.
Best Practices for Kubernetes Deployments
In the above demo, we saw how env zero stepped in to make managing Kubernetes infrastructure and application deployment a breeze. By providing a cohesive environment for leveraging Terraform and Helm, env zero ensures your deployments are streamlined and efficient.
Here is how this plays into general Kubernetes best practices:
1. Embracing a Layered Deployment Strategy
env zero amplifies the effectiveness of using a layered deployment strategy. By managing Terraform for infrastructure and Helm for applications through env0, you establish a clear division of responsibilities. This not only aids in maintenance and updates but also ensures that each layer is optimized for its specific role in the deployment process. env0's dashboard and automation capabilities provide a unified view and control over these layers, making it easier to manage complex Kubernetes environments and Kubrenetes resources.
2. Streamlining Costs and Performance
With env0, you can monitor and optimize your deployments directly. env zero provides insights into resource utilization and costs, helping you make informed decisions on scaling and optimizing your infrastructure for both performance and cost-effectiveness. This means you're not just deploying efficiently with Terraform and Helm; you're also continuously improving your deployments based on real-world data.
3. Enhancing Security and Compliance
Leveraging env0's capabilities ensures that security is baked into your deployment process from the start. With env0, you can enforce policies and ensure that every deployment adheres to your security standards, including the use of minimal base images, implementing RBAC, and encrypting sensitive data. env0's policy enforcement ensures that your Kubernetes resources and deployments are not just efficient and cost-effective, but also secure.
4. Seamless Workflow Integration
env zero integrates into your existing workflows, connecting with Terraform to automate Kubernetes cluster creation and with Helm to streamline application deployments. This establishes a seamless workflow where infrastructure creation, application deployment, and management are all automated, reducing manual errors and saving valuable time.
Conclusion
To wrap up: leveraging env zero alongside Terraform and Helm not only aligns with but also enhances best practices for managing Kubernetes resources and deployments. From embracing GitOps to optimizing for cost and performance, and ensuring a secure, layered deployment strategy, env zero acts as the linchpin that brings it all together. It’s about making your Kubernetes deployments not just possible, but efficient, manageable, and aligned with the best practices that drive modern cloud-native development.
By integrating env zero into your Kubernetes deployment strategy, you're not just following best practices; you're setting a new standard for excellence in deployment and management, ensuring your infrastructure and applications are as robust, efficient, and secure as possible.
Using Terraform, Kubernetes, and Helm: The Power Trio


In this blog post we’ll walk you through setting up your first monitoring and observability system to gather data about your systems, deployed in AWS cloud using env0.
When you’re deploying any software environment or infrastructure, whether it’s containerized or not, you must think about your application monitoring and observability strategy. This not only saves developers from being woken up at 2 a.m. by an alert noise to fix an issue, but it also gives you the ability to truly look into your application performance.
In this blog post, you’ll learn about what monitoring and observability are, one of the most popular stacks, and how to deploy it at scale into AWS using env0.
What are monitoring and observability?
Monitoring and observability are often referred to as if they’re the same thing, but they have two very different purposes for developers and engineering teams.
This topic in itself can be an entire book, so I’ve tried to keep this section brief, but with enough information to provide context on the difference between their function and technologies.
Monitoring
Monitoring is all about observing data in real time, or tracking history of data. For example, if you’ve ever walked into a Network Operations Center (NOC) or walked over to the IT space in your organization, you may have seen some big screens with data statistics and dashboards.
Monitoring collects telemetry data that gives real time visibility and the ability to look into application performance. These tools collect data on how each component such as CPU, memory, bandwidth, and system performance at a high level. These software tools are often used by developers to measure software performance issues and optimize incident response times.
Observability
What makes observability important is that it deals with the "unknown unknowns," providing visibility into the entire application, and allowing developers to synthesize that raw data and form actionable insights to drive business outcomes.
Observability addresses the "three pillars" of data, then goes beyond to provide value to customers:
- Traces: Track application availability and health from an end-to-end perspective
- Metrics: Collect time series data, which is used to manage, optimize, and predict expected application and system performance, both good and bad
- Logging: Stores logged events written by apps, users, and systems. As all engineers know, logs are a lifesaver when troubleshooting
Beyond raw data
In short—with monitoring, you gather real time data about each system, component, service, events, infrastructure, etc. But despite the growing body of data under our control, in any complex system, blind spots will always remain.
Observability goes beyond what's monitored and under control. The telemetry data collected (from logs, metrics, and traces) provides context that leads to insights that drive business value for customers. Observability == inference.
What are Prometheus and Grafana?
Now that you know the theory behind the collection of data and hypothesis inference about your systems, you may be wondering: What tools and platforms are available to help developers collect data and hypothesize inferences about their service?
There's a greater variety than users might expect. A few notable ones are:
- Datadog
- AppDynamics
- AWS CloudWatch
- Azure Monitor
- … and a whole host of other amazing cloud native tools and open source solutions
In the cloud native, Kubernetes, and containerization world, a lot of users gravitate towards one specific stack: Prometheus and Grafana.
Although this stack can be used to manage workloads outside of Kubernetes clusters, they both have a ton of compatibility and support for containerized applications at scale. They’re both an open source tool / software which gives developers a ton of control. It also means you don’t have to pay for them, which is a great value for users who otherwise wouldn't be able to access the data.
Prometheus and Grafana are enterprise ready in a lot of cases. This stack isn’t just for pre production processes. Many large organizations deploy these technologies at scale in their cloud and have battle-tested it to capture data for clusters ranging from 5-500.
If you want a little enterprise support behind it, a lot of the major cloud providers also have Prometheus and Grafana services (for example Amazon Grafana is one of the available managed, scaled, done-for-you AWS Services).

So, which tool collects what data?
Prometheus is all about collecting observability data. It consumes the raw data from a specific endpoint. In Kubernetes, the `metrics/` endpoint can be exposed and then Prometheus can retrieve metrics from that endpoint.
Grafana is used to view the data in UI-friendly and human-readable dashboards. Although you can definitely view the data in Prometheus and they’re very readable, they’re much easier to interpret and act upon when monitored in dashboards via Grafana.
The code
So far you’ve read a lot from a theoretical perspective of what monitoring does, what observability does, and a few different software tools that you can test to help with these use cases in production. Now, it’s time to dive into the hands-on piece and deploy our own tools and infrastructure into the cloud using AWS services.
Prerequisites
To follow along with the hands-on portion of this blog post, you will need the following:
- An env zero account (you can sign up for a trial here)
- A version control system/source code repo like GitHub to store the code in for deployment purposes (demo repo)
- Access to an AWS account to deploy into the cloud (you can sign up for a free trial/tier here)
- Credentials configured in your env zero environment for AWS
- An Amazon Elastic Kubernetes Service (Amazon EKS) cluster running in the cloud. If you don’t have one, you can learn how to deploy an Amazon EKS cluster with env zero here (LINK the blog post Deploy AWS ECS With CloudFormation and env zero once published)
This section will demonstrate the infrastructure configuration that will be used to deploy Prometheus and Grafana services into an Amazon EKS cluster and start gathering our own observability data.
Because this is an installation of your own tools of Prometheus and Grafana in the cloud, there isn’t specific infrastructure code you need to reference for this. Instead, you’ll use an env zero configuration to deploy into AWS. The env zero configuration contains steps to launch the Amazon EKS cluster in a step-by-step fashion.
The workflow goes as follows:
- Log into and access the Amazon EKS cluster
- Install Helm
- Add the Grafana Helm Chart
- Add the Prometheus Helm Chart
- Create a Service Account in Kubernetes for Grafana
- Install Grafana and Prometheus in the monitoring namespace to start collecting data
version: 1
deploy:
steps:
setupVariables:
after: &login-k8s
- aws eks --region=$AWS_DEFAULT_REGION update-kubeconfig --name $CLUSTER_NAME
- if [[ ! -e helm-v3.10.2-linux-amd64.tar.gz ]]; then wget https://get.helm.sh/helm-v3.10.2-linux-amd64.tar.gz; fi
- tar -zxvf helm-v3.10.2-linux-amd64.tar.gz
- ./linux-amd64/helm repo add grafana https://grafana.github.io/helm-charts
- ./linux-amd64/helm repo add prometheus-community https://prometheus-community.github.io/helm-charts
- ./linux-amd64/helm repo update
# - kubectl create namespace monitoring
# - kubectl create sa release-name-grafana-test -n monitoring
- ./linux-amd64/helm template prometheus-community/prometheus -n monitoring > prom.yaml
- ./linux-amd64/helm template grafana/grafana -n monitoring > graf.yaml
destroy:
steps:
setupVariables:
after: *login-k8s
Ensure you add the code above to the root directory of the Git repo you’re using to deploy and name it [.code]env0.yaml[.code].
Collecting Telemetry Data by Deploying Prometheus and Grafana with env0
With the [.code]env0.yaml[.code] configuration, you can now prepare env zero to deploy Prometheus and Grafana into Amazon EKS.
First, create a new environment.
For the VCS environment, choose to run Kubernetes so that the system can easily scale.

Select the repo where the [.code]env0.yaml[.code] exists along with the branch. You can leave the Kubernetes folder blank as you’re not deploying a Kubernetes manifest.

Ensure that the [.code]AWS_DEFAULT_REGION[.code] and [.code]CLUSTER_NAME[.code] variables match your EKS cluster.

Once complete, you’ll see in the env zero dashboards that your cloud deployment has started.

You’ll get a prompt to approve the Prometheus and Grafana deployments.

Once complete, you’ll see the AWS resources deployed to the cloud available on your AWS Elastic Kubernetes Service cluster.

Congratulations! You're now gathering data from the services you've deployed to the cloud in AWS!
This is part four of a four-part series. Keep reading to learn more!
Tutorial: How To Set up Prometheus and Grafana with Amazon EKS


For those headed to KubeCon NA this year, we know planning your itinerary can be stressful. That’s why our team has got you covered with a guide on how to maximize your conference experience, including can’t-miss talks, networking events, and even places to explore in Chicago.
Best Talks to Attend
For each day of the conference, we’ve picked out the talks featuring the most interesting and unique use cases.
On Tuesday, we recommend checking out the Keynote “Environmental Sustainability in the Cloud Is Not a Mythical Creature.” Going beyond FinOps to GreenOps, the talk covers evolving initiatives and solutions, and how responsible energy consumption aligns with cloud cost optimization.
On Wednesday, be sure to catch “The Way We Build the Largest Public and Private Cloud Infrastructure in Vietnam.” As a company that’s passionate about Infrastructure-as-Code, we can't wait to see how Viettel, the largest telco in Vietnam, went from zero to scale when implementing, building, and managing such a large infrastructure.
Finally, on Thursday, don’t miss “The Stars Look Very Different Today”—discussing how the SKA Observatory (SKAO) leverages Kubernetes and Cloud native to help us learn about the infinite mysteries of our expanding universe.
Check out the full conference schedule here.
Best Networking Events
After visiting our Booth at G10 (featuring some awesome swag, including a chance to win a Steam Deck!), we recommend checking out the Kuberoke (“The first and only Kubernetes Karaoke community”) event on November 7 to sing, dance, and belt your heart out.
If you’re an introvert or prefer something quieter, SIG Boba is an inclusive event at a boba shop for playing card and board games, plus meeting new like-minded folks in the community.
For the full list of happy hours, cocktail mixers, and other events, head to conferenceparties.com/kubecon23.
Places to Explore in Chicago
Here’s our shortlist for places to eat, drink, and see during your stay in the city:
☕️Coffee: Check out Overflow Coffee about a mile from the venue—featuring great coffee, good vibes, and local Chicago musicians.
🍕Pizza: Chicago is known for its deep dish pizza, and we recommend Pequod's Pizza for the best the city has to offer. Pro tip—try the crust well-done.
🌱 Vegan/Vegetarian: Veggie House is a well-loved Chinese spot close to KubeCon that caters to health-conscious folks, and is also located in the heart of Chicago’s Chinatown.
💎 Local Gem: If you're looking for something to do that isn't your typical tourist attraction, Ping Tom Park is a 17-acre park next to the South Chicago river with biking/jogging trails and arguably the best views of the city.
We hope you enjoy your trip to KubeCon NA 2023 in Chicago, and we hope to see you at Booth G10! Don’t forget, you can also pre-schedule a personal demo meeting with us for a chance to win a unique env0-branded Apple Watch. See you there!
The Insider's Guide to KubeCon NA 2023 in Chicago

Backstage, an open platform for building developer portals created by Spotify, enables product teams to ship high-quality code quickly and streamlines the development from end to end. Enabling engineering hyper growth at Spotify since 2016, Backstage is a hub for everything developers need to do their work -- including docs, runbooks, and API specs. Spotify saw engineering onboarding time drop by 55% in the two years after deploying Backstage internally while onboarding hundreds of engineers yearly. Roadie builds and supports Backstage for customers via their SaaS platform.
Roadie’s SaaS platform handles hosting, upgrades and security, ensuring that developers always have access to the latest Backstage features in a monetized business model.
Roadie’s platform enables developers to:
- Cut onboarding time with discoverability
- Customize Backstage using a drag-and-drop composer
- Customize Backstage to their organization's needs
- Easily make changes to accompany growth
The env zero solution
With continued growth of its engineering teams, Roadie chose env zero to improve developer productivity, reduce downtime and enable teams to ship high-quality code quickly. The env zero solution has delivered numerous benefits to Roadie:
- With GitHub integration, Roadie can easily see the Terraform plan result before merging a Pull Request. Roadie can also be certain that after the PR is merged, the new code will run in production automatically.
- By integrating env zero with Slack, Roadie no longer has to worry about problems in any of the workspaces as they will get any relevant notifications and be able to act on them.
- With a Web UI, Roadie can easily browse all their workspaces and know what state they are in.
- API-driven Terraform stack management allows Roadie to create, list and delete workspaces via an API, reducing weeks of work and effort. As a result, Roadie can build management services and scripts to on-board tenants quickly and easily.
- Roadie benefits from the use of custom workflows for the creation and teardown of stacks. In particular, env zero allows Roadie to use custom workflows with a Kubernetes provider which does not handle expired tokens in Terraform. Furthermore, when a workspace is created, there are often a handful of tasks that must be completed outside Terraform and these are also handled in custom workflows.
All of this allows developers to focus on innovation and product development instead of getting bogged down with reinventing the wheel around repetitive tasks.
Roadie manages a multi-tenant SaaS managed service with env zero

KubeCon Europe, the flagship CNCF dev conference, is heading to Paris from March 19-22 at the Porte de Versailles expo.
The envzero team will be there in full force, and as usual, we're excited to connect with the amazing cloud-native engineering community.
If there, be sure to swing by booth L12 to discover our latest platform features, pick up some swag, and participate in our Meta Quest 3 raffle.
We also invite you to join us for the talks and panels we'll be hosting this year, both on KubeCon's main stage and at the inaugural OpenTofu Day event. More on that below.
📅 Lastly, if you'd like to talk shop, schedule a meeting using this link and you'll have the chance to win an Apple Watch as a 'thanks-for-helping-us-plan-ahead' gift.

Make Note: Visit us at Booth L12
Drop by our booth to meet the members of the OpenTofu founding team and discuss the project, its progress, and the road ahead.
While there, make sure to explore some of our newest capabilities, such as the Environment Discovery feature. With it, you can effortlessly create, plan, deploy, and destroy environments by simply creating pull requests within a preconfigured directory structure.
Also, don't forget to check out the awesome swag we've prepared for you this year, including limited edition T-shirts, unique KubeCon Paris stickers, and some exciting OpenTofu stuff we keep as a surprise for now.
And of course, take a moment to register for our raffle for a chance to win a brand new Meta Quest 3!

First-of-many OpenTofu Day
OpenTofu, the open-source Terraform alternative (obviously), holds a special place in our hearts.
That's why we're thrilled about the first-of-many OpenTofu Day, hosted by CNCF, on March 19th.
Join us for an exclusive opportunity to dive deep into the OpenTofu community, gain behind-the-scenes insights, and discover real-world use cases from companies that have already made the switch.
During the day we will participate in the following events:
| OpenTofu Registry: The Low-Maintenance & Highly-Available Open Source SaaS |
|---|
9:50 - 10:15, Level 7.3, Room E05 - E06 |
| OpenTofu Power Users Panel |
|---|
11:40 - 12:15, Level 7.3, Room E05 - E06 |
IaC Experts Panel
Our CEO Ohad Maislish will be part of the panel discussion taking place on March 21st. It promised to be an engaging conversation.
To tune in, you can find the details listed below:
| The IaC Evolution, On Open Source and Everything Else |
|---|
11:55 - 12:30 CET, Level 7.3, Room S04 |
See you soon in the city of lights!
Meet Us in Paris for KubeCon Europe 2024 (and OpenTofu Day)!


We're excited to be a part of KubeCon Chicago 2023, and we can't wait to meet you there!
KubeCon, the premier gathering for cloud-native enthusiasts, is set to take place from November 6th to 9th at McCormick Place West. It's an event that brings together industry leaders, innovators, and experts to explore the latest trends and developments in the world of Kubernetes and cloud-native technologies.
Visit our team at Booth G10 to dive into the world of cloud management and infrastructure-as-code best practices, grab awesome swag, and take a part in our Steam Deck raffle (details below).
You can also pre-schedule a personal demo meeting with us for a chance to win a unique env0-branded Apple Watch.

Cooking with OpenTofu
Together with other founding members we've just released the first version of OpenTofu, which you can already test using our new integration feature.
If you haven't been following the news, OpenTofu is meant as a drop-in open-source replacement for legacy Terraform. Our CTO Omry Hay is on OpenTofu's steering committee will be at KubeCon in person to answer all of your question about this project.
Learn about Our Roadmap and New Features
We will be providing demos upon request and answering all your questions about using envzero with your tech stack and different kinds of tools.
We'll share how envzero can elevate your infrastructure management practices and showcase our latest innovations in infrastructure-as-code automation, and other envzero features like our native k8s integration, easier SHAG installation for Docker, and upcoming ‘Day 0 Environment’ feature.
Grab some Swag and Join a Raffle!
Take the opportunity to win a Steam Deck from env0! Simply drop by our booth, engage with our experts, and get your entry in our raffle!

With Halloween and Día de los Muertos coming up, we’ve got some awesome stickers and special edition shirts that you’ll want even after the holidays are over.
Just our way to remind you that development is always scary. :)

So swing by and let’s have a chat. Looking forward to seeing you there!
Meet Us in Chicago for KubeCon NA 2023!