Today, we are happy to announce an upgrade to the navigation experience on the env zero platform, designed to make project management smoother and more intuitive.
This enhancement provides improved oversight of your entire IaC activity, enabling quicker adjustments and more precise control over your projects.
What’s New?
Going beyond just a series of UX improvements, this update opens the door to multiple practical benefits, which I'll cover below. But first, let’s dive into the highlights of this release:
- A new interface for easier navigation through sub-projects:
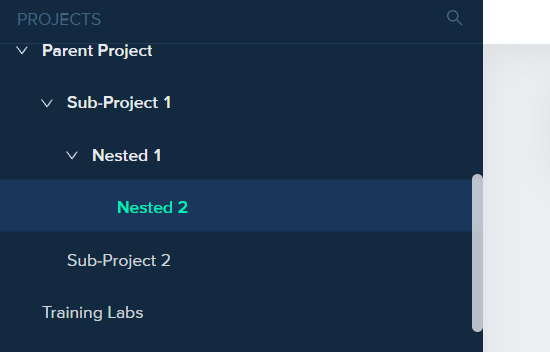
- A simple one-click way to add sub-projects to the parent project:

- An improved search capability, enabled by a behind-the-scenes scoring system, will accurately match relevant projects and sub-projects with your search query.
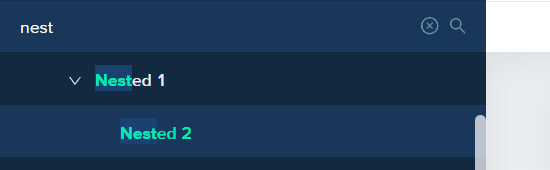
- A quicker way to reach setting screens and dashboards.
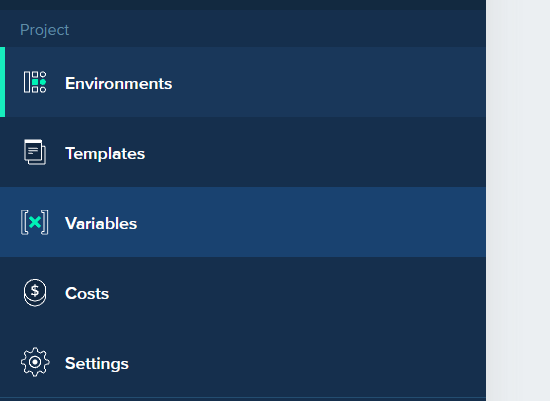
Together, these streamline the task of IaC project management, saving valuable time, creating clarity, and helping you to quickly move through your tasks.
The Importance of Projects’ Structure
To understand the “why” behind our new navigation, consider the challenges that our customer would encounter as they scale their IaC operations, which include:
- Disorganization: Initially manageable systems can rapidly evolve into complex and messy configuration.
- Attribution issues: With expanding team sizes and project scopes, pinpointing the source of specific changes becomes increasingly difficult, hindering troubleshooting, cost analytics, etc.
- Hierarchical limitations: Traditional project management often sticks to a "flat" single-tier hierarchy, which may not suffice for the granular control required in complex setups.
One effective way of dealing with these (and other) hurdles, is by utilizing a structured hierarchy of projects and sub-projects. This allows you to introduce granular control by allocating sub-projects for different teams, applications, or environment types (e.g., development, staging, and production).
Here are a few examples of how that would work:
- Access control: Taking the above example and allocating sub-projects for particular applications, you can use our platform to easily manage role-based access.
For instance, you might prevent members of the mobile app team from making unauthorized changes to the payments app. - Approval policies: By assigning each environment (development, production, staging) to a separate sub-project, you can use env zero to set distinct approval policies.
For example, you might require senior team members to approve changes in the production environment, but not for development or staging. - Variables and secrets management: Using env zero you can set up variables and secrets to be inherited from parent to sub-project. This saves time and improves reliability and coherency, while still giving you the option to customize setups for specific sub-projects.
- Cost controls: Our platform offers a set of cost management tools that provide detailed cost estimations for planned infrastructure changes, customizable alerts to prevent budget overruns, and detailed financial breakdowns of actual expenses.
These controls are configurable at both project and sub-project levels, helping you optimize your IaC expenses. For instance, you can set tighter budget thresholds for your staging and development environments, or put in place tailored alerts for areas where expenses are prone to ramp up.
Wrapping up
Implementing a hierarchy of projects and sub-projects is a make-sense good practice that enables precise customization on the one hand and standardization on the other, helping you meet broad organizational needs and specific operational demands.
With its new navigational upgrades, env zero now offers new and better ways to visualize and interact with your projects, saving precious time and enhancing efficiency and accuracy.
Want to learn more?
Open a free account and try env zero yourself or schedule a technical demo to see our platform in action.
Related Content

The new env zero Agent CLI is available now. Ask your coding agent about your infrastructure in plain English, and it answers from real state, inside the same roles, approvals, and audit trail your team already runs on.
Today we are launching the Agentic Experience (AX) on env zero, powered by the new env zero Agent CLI. The idea is simple. You point your coding agent, whether that is Claude Code, Cursor, Codex, or Copilot, at your env zero infrastructure, ask it a question in plain English, and it answers from your real environments, deployments, and drift instead of guessing. It is available to every account starting now.
Coding agents are already inside your workflow. They read your codebase, propose changes, and increasingly get asked to do the work rather than describe it. The open question is what they are plugged into when they try. Point one at your infrastructure today and, on most platforms, it sees a thin slice of current state, fills the gaps with guesses, and burns tokens scraping an API that was never meant for a machine to reason over. It can talk about your infrastructure. It cannot reliably operate it.
The Agent CLI changes what the agent is standing on. It gives your agent the full picture, every environment, module, template, plan, and the deployment history behind them, in a form built for a context window instead of a browser tab. Ask a question, and the agent reads real state to answer it. Ask for a change, and it acts through the same roles and approvals a person would. The commands in this post are the plumbing. The product is the conversation on top of them.
Ask your infrastructure a question
Here is what the Agentic Experience looks like in practice. Each example is a prompt an engineer types to their agent. Underneath each one is the command the agent actually runs, the receipt for what it did. You never have to type the command yourself.
"Why did payments-staging go red? Is it our change or drift?"
The agent pulls the environment's full context, its state, recent deployments, and a drift or failure summary, in a single request, then tells you whether the failure traces to your last deploy or to something that changed underneath it.
env0 context payments-staging
"Before I merge this, plan the change against prod and tell me if anything gets replaced."
The agent starts an approval-gated deployment, so the plan runs but nothing applies without a human. It reads the plan, flags any resource that would be replaced rather than updated, and leaves the change waiting for your sign-off.
env0 environment deploy prod --requires-approval
"Which environments in data-platform haven't deployed in 30 days, and what are they costing us?"
The agent lists every environment in the project as structured data, filters by last deployment date, and adds up the cost estimates, so you get the stale environments and their spend in one answer.
env0 environment list --project data-platform -o json
"Anything waiting on my approval? Summarize what each one changes."
The agent finds the deployments paused at an approval gate, reads each plan, and gives you a one-line summary of what every pending change would do before you approve or cancel it.
env0 deployment list -o json
None of these require you to know the commands, and that is the point. The Agent CLI hands the agent structured JSON on stdout, errors on stderr, and stable exit codes, so it can chain reads and actions and know exactly what happened at each step without you translating between English and the API.
Governance that already applies to agents
This is the part security teams care about, and it works today.
An agent on the Agent CLI is not a special case that sits outside your controls. It authenticates as a real env zero identity, per user through the browser or per service through an API key, never a shared token, so every read and every action is attributable to someone rather than fired anonymously.
Because your existing role-based access control applies to that identity, you decide what the agent can do simply by choosing the identity you give it. Hand it a read-scoped identity and you get an agent that can diagnose anything and change nothing. It can pull context, list environments, and read plans and logs, while deploy, destroy, and approve are not available to it at all. Give it a broader identity and the approval gates still hold. A deployment that requires approval pauses for a human no matter who or what started it, and destroying infrastructure still takes an explicit confirmation.
So the safe pattern is available now, with no new product to adopt. A read-only agent that investigates and explains, a human in the loop for anything that changes infrastructure, and a full audit trail, because the agent acted as itself and not as a key nobody can trace.
The skill is the seed of your agent operating policy
Getting an agent set up is one command.
env0 skill install
That writes a usage guide into your coding agent's config so it knows the exact commands, flags, and output formats for the version of the Agent CLI you have installed. It sets up Claude Code by default, with --agent cursor, --agent codex, or --agent copilot for the others.
Two things about that guide matter more than they first appear.
It is version-matched. The agent works from the command surface you actually have, not one it half-remembers from training. Invented flags are the fastest way for an agent to lose an engineer's trust on infrastructure, and a version-matched guide is how you keep them out.
And it is a file in your repository, not a hosted black box. You commit it, and you extend it. Add your own conventions on top: the golden-path templates a new environment should start from, a rule that no agent touches prod without approval, a list of projects that are off limits. Once it is committed, every agent that every engineer runs inherits the same operating manual, and it gets reviewed in a pull request like any other code. You are not just installing a skill. You are planting the seed of your team's agent operating policy, in version control, where it belongs.
Why it goes deeper than an API wrapper
A generic CLI wrapped around an API is only as good as the API underneath it. env zero already understands your environments, your modules, your deployment history, and how they connect, and the Agent CLI is built on that understanding rather than layered over it.
The clearest example is env0 context. It returns an environment's state, recent deployments, and drift or failure summary in a single call, so an agent diagnoses a broken deployment in one request instead of stitching the picture together across several. Fewer round trips, less context spent, and an answer grounded in real state.
It also clears the three obstacles we heard about from nearly every team that tried to put agent access in front of a platform. Security teams distrusted a shared, unattributable credential. One enterprise customer's security team blocked our old MCP server outright and started patching around the credential model before they ever raised it with us. Setup was a wall. As one account team put it while describing the self-hosted container, four out of five customers got stuck standing it up. And even where it worked, the surface underneath was thin, showing the latest deployment only, with no history. The Agent CLI answers all three. There is no container to stand up, a real per-identity login replaces the shared token, and the surface is deep enough that an agent never has to fall back to the raw API for context.
The old MCP server keeps working for existing integrations, but new agent capability lands in the Agent CLI now. That is where the Agentic Experience lives going forward.
What's in this release
- Point Claude Code, Cursor, Codex, or Copilot at env zero and ask about your infrastructure in plain English
- Read across environments, deployments, projects, templates, and plans, including full history
- Diagnose a failed environment (state, recent deployments, and drift) in a single env0 context call
- Run core actions when you allow it: create, deploy, destroy, approve, cancel, abort
- Scope agents with your existing roles and approvals, with every action attributable to a real identity
- See cost estimates alongside your reads
- Install a version-matched, extensible skill for your agent with one command
What comes next
Today you scope an agent by choosing the identity you give it. Next, we are making read-only the default for agents regardless of the human behind them, with write access as an explicit, audited step someone has to grant. An engineer with full permissions still gets a read-only agent unless they deliberately elevate it.
We are also expanding what an agent can see, starting with policy and governance configuration, so it can read the guardrails a project runs under and not just its deployments, and we are widening the read surface from there.
The goal has not changed. Give an agent enough real context to be useful, and never more access than it has earned.
Get started today
The env zero Agent CLI is available now. Install it with Homebrew or npm:
brew install env0/tap/env0
- Sign in with:
env0 login - Run and setup your agent with:
env0 skill install - Ask your first question
The full env zero Agent CLI documentation covers every command, flag, and output format.
Want a walkthrough? Schedule a technical demo to see the Agentic Experience in action.
FAQ
What is the env zero Agentic Experience? It is the ability to point a coding agent, such as Claude Code, Cursor, Codex, or Copilot, at your env zero infrastructure and work with it in plain English. The agent answers from your real environments, deployments, and drift, and can take action through the same roles and approvals a person would. It is powered by the new env zero Agent CLI, available now.
How is this different from the old MCP server? The MCP server needed a self-hosted container and a single shared credential, and it only ever saw the latest deployment. The Agent CLI installs directly as a single binary, authenticates per user or per service account, reads the full history and diagnosis surface, and returns structured output an agent can parse without extra tooling. The MCP server keeps working for existing integrations, but new agent capability lands in the Agent CLI.
Can I stop an agent from changing infrastructure? Yes, today. An agent authenticates as a real env zero identity and inherits that identity's role. Give it a read-scoped identity and it can diagnose but not deploy, destroy, or approve. Even with a broader identity, approval gates still pause changes for a human, and every action is recorded against the identity that ran it.
What exactly does the skill do? env0 skill install writes a version-matched usage guide into your agent's config so it knows the real commands and flags for the CLI you have installed, which keeps it from inventing them. Because the guide is a file in your repository, you can commit it and extend it with your own conventions, so every engineer's agent inherits the same rules.
What is on the roadmap? Read-only-by-default access for agents regardless of the human behind them, with an explicit, audited path to write access, broader policy and governance visibility in the CLI, and continued expansion of the read surface.
Get started: install the env zero Agent CLI or read the docs
Announcing the env zero Agentic Experience: Point Your Coding Agent at Your Infrastructure


You run [.code]terraform apply[.code], it fails partway through, and the next command you run refuses to move: [.code]Error acquiring the state lock[.code]. Nothing is broken yet, but nothing will proceed either until the lock is cleared.
This guide covers what [.code]force-unlock[.code] actually does, when it is safe to use, how to find the lock ID on every major backend, and what to do if the command itself does not fix things.
What does terraform force-unlock do?
Terraform locks state before any operation that could write to it. The lock stops two processes from writing to the same state file at once, which is the most common way a state file gets corrupted. Locking happens automatically and silently on every plan and apply where the backend supports it. You will not see a message unless acquiring the lock takes longer than expected.
[.code]force-unlock[.code] is the manual override for when that automatic process gets stuck. It removes the lock record so a new operation can proceed. According to HashiCorp, the command does not modify your infrastructure, and on most backends it does not touch your state data either. It just clears the record that says the state is currently held.
Usage:
terraform force-unlock [options] LOCK_ID
The only option is [.code]-force[.code], which skips the yes or no confirmation prompt. That is useful inside a script or CI job where nothing is available to type “yes” into. Otherwise leave it off, since the confirmation step is the last chance to catch a mistake before you unlock something someone else is actively using.
The lock ID is not optional and is not guessable. Terraform prints it in the error message when a lock is already held, and [.code]force-unlock[.code] requires an exact match. Per HashiCorp's own documentation, the ID works as a nonce, a one-time verification token that ensures a lock and an unlock target the same lock. That is deliberate: you can only release a lock you can identify, not just any lock on the state file.
One thing worth flagging up front: on the local backend, a stuck lock can only be cleared by the same machine and user that created it. There is no separate process to force it from elsewhere, which is one more reason most teams move to a remote backend, such as the ones covered in this backend configuration guide, before this becomes a live problem.
When should you use the force-unlock command?
Treat [.code]force-unlock[.code] as a last resort, not a first response. If two operations are genuinely running against the same state at the same time, forcing a lock open defeats the entire purpose of state locking and can leave you with a corrupted state file. Only run it when you are certain the process that created the lock is no longer active.
A stuck lock usually traces back to one of a few causes:
- A [.code]terraform apply[.code] or [.code]plan[.code] was cancelled or errored mid-run, for example because a CI job timed out or someone hit Ctrl+C, so Terraform never reached the step where it releases the lock.
- The machine or build agent running Terraform lost its network connection to the backend before the lock could be released.
- The backend storage itself changed mid-operation, for example a Terraform run modifying firewall rules, private endpoints, or access policies on the very storage account that holds the state file.
If none of those match your situation and you are not sure why the lock exists, treat that as a reason to investigate before clearing it, not a reason to assume it is safe to force.
Where to find the lock ID for every backend
In most cases you will not need to go looking. The lock ID appears directly in the [.code]Error acquiring the state lock[.code] message, under the [.code]ID:[.code] field, alongside who holds it and when it was created. The backend-specific detail below matters mainly when you are troubleshooting secondhand, for example clearing a lock a teammate reported without a fresh error message in front of you.
Local backend
Terraform writes a [.code].terraform.tfstate.lock.info[.code] file next to the state file while an operation is in progress. It is a small JSON object containing the lock [.code]ID[.code], the operation type, and who created it. On clean exit, Terraform deletes this file automatically. As noted above, a lock created by one machine cannot be released by [.code]force-unlock[.code] from a different one.
Amazon S3
As of Terraform 1.11, the S3 backend supports native state locking through the [.code]use_lockfile[.code] argument, and no longer requires a separate DynamoDB table. Setting it to [.code]true[.code] tells Terraform to create a lock object in the same S3 bucket as your state, using conditional writes so only one process can create it at a time.
terraform {
backend "s3" {
bucket = "mybucket"
key = "path/to/my/key"
region = "us-east-1"
use_lockfile = true
}
}
With native locking, the lock ID is whatever the error message reports; there is no separate table to query. If your configuration still uses the older [.code]dynamodb_table[.code] argument, note that HashiCorp has deprecated it in favor of [.code]use_lockfile[.code]. On that legacy path, the lock lives as an item in the DynamoDB table, keyed by a partition key named [.code]LockID[.code], and you can inspect it directly:
aws dynamodb get-item \
--table-name your-lock-table \
--key '{"LockID": {"S": "your-bucket/path/to/terraform.tfstate"}}'
Azure Blob Storage
Azure Blob Storage implements locking through native blob leases, with no extra backend configuration required. If a run is interrupted mid-apply, the lease can be left in place. The lock ID appears in the error message, but you can also inspect the lease state directly:
az storage blob show \
--account-name YOUR_STORAGE_ACCOUNT \
--container-name YOUR_CONTAINER \
--name path/to/terraform.tfstate \
--query 'properties.lease'
If [.code]force-unlock[.code] is not an option, for example the lock ID is unavailable, you can break the lease directly through the Azure CLI, which achieves the same result at the storage layer:
az storage blob lease break \
--account-name YOUR_STORAGE_ACCOUNT \
--container-name YOUR_CONTAINER \
--blob-name path/to/terraform.tfstate
Google Cloud Storage
The GCS backend also locks natively with zero extra configuration. Terraform writes a lock object at [.code]/.tflock[.code] in the same bucket as your state, and the lock ID is the object's generation number, which is included in the error message. Deleting that object directly is the manual equivalent of [.code]force-unlock[.code] if the CLI command fails for some reason.
HCP Terraform and Terraform Enterprise
This is a common point of confusion: [.code]terraform force-unlock[.code] is a CLI command that works against backends where Terraform itself manages the lock file. HCP Terraform and Terraform Enterprise instead lock and unlock workspaces through their own UI and API, not the CLI command. In the workspace's Actions menu, you can select Lock workspace or Unlock workspace directly, or call the workspaces API endpoint to do the same thing from automation.
Consul
With the Consul backend, lock information lives in the Consul key-value store rather than in a file. You can list it with the [.code]consul kv get [.code] command, or query the same data through Consul's HTTP API.
Using terraform force-unlock: a worked example
- Identify the lock ID from the error message. For example: [.code]Lock Info: ID: b8814894-4a5f-217b-e97b-c4f5c02a1f88[.code].
- Confirm nobody else is running an operation against this state. Check your CI/CD dashboard, ask your team, or check the environment's deployment history if you are running on a platform that centralizes this, before assuming the lock is actually stale.
- Run the command with the ID from step one: [.code]terraform force-unlock b8814894-4a5f-217b-e97b-c4f5c02a1f88[.code]. Confirm the prompt with [.code]yes[.code], or add [.code]-force[.code] if you are running this non-interactively.
- Verify the fix by re-running the command that originally failed, such as [.code]terraform plan[.code]. If it proceeds past the locking step without error, the lock is cleared.
Unlocking remote state: alternatives to force-unlock
Wait instead of forcing: -lock-timeout
If two operations occasionally overlap for a few seconds, for example two CI jobs kicking off close together, [.code]force-unlock[.code] is the wrong tool. The [.code]-lock-timeout[.code] flag tells Terraform to wait for the lock to clear on its own instead of failing immediately:
terraform plan -lock-timeout=5m
This is worth setting as a default in CI pipelines that run plan, apply, or destroy operations back to back, so a brief overlap resolves itself instead of surfacing as a lock error at all.
Manual removal as a last resort
Occasionally [.code]force-unlock[.code] itself fails, usually because the backend is unreachable or credentials cannot reach the lock record. HashiCorp's guide to recovering state from backup covers this scenario directly. In that situation, the remaining options are backend-specific: delete the lock object from S3 or GCS, edit or remove the DynamoDB item, or break the Azure blob lease as shown above. All of these bypass Terraform entirely, so treat them with the same caution as [.code]force-unlock[.code] itself.
Coordinate before you unlock
Whichever method you use, confirm no other process is mid-write before you touch the lock, and consider pulling a backup first with [.code]terraform state pull[.code]. Never use [.code]-lock=false[.code] as a standing workaround for frequent lock errors. It disables the protection entirely rather than resolving whatever is causing the contention.
Troubleshooting force-unlock errors
The lock ID does not match
[.code]force-unlock[.code] will refuse an ID that does not match the current lock. This almost always means you are using a stale ID from an old error message. Re-run the failing command to get the current lock's ID and try again.
Permission errors during force-unlock
Clearing a lock requires write or delete access to wherever the lock record lives, for example [.code]s3:DeleteObject[.code] on the lock object, or the equivalent DynamoDB, GCS, or Azure permission. A permissions error here usually points to the credentials Terraform is running with, not the lock itself.
The same lock error comes back immediately
If you clear a lock and it reappears right away, something is still actively writing to that state. Stop and investigate before unlocking again. This pattern usually means step two of the worked example above was skipped.
Managing state locking at scale with env zero
Clearing a stuck lock by hand does not scale once a platform team is managing hundreds of environments across multiple backends. Ad Hoc Tasks in env zero let you run a command, including [.code]terraform force-unlock -force LOCK_ID[.code], directly on the environment's deployment container from the UI. That means resolving a stuck lock does not require local CLI access, a checked-out copy of the Terraform configuration, or direct credentials to the backend that holds the state.
By default, ad hoc tasks are restricted to organization administrators, since they allow arbitrary commands against a live deployment container. Teams that want to delegate lock-clearing to platform engineers without granting full admin access can do that with a custom role scoped to just that permission.
It is worth distinguishing this from Environment Locking in env zero, which is a separate, deliberate governance control rather than Terraform's automatic state lock. Locking an environment in env zero blocks deploys, destroys, plans, and drift detection outright, with a reason attached for anyone else who looks at it, and it stays in effect until someone with permission unlocks it. A Terraform state lock, by contrast, is transient by design and normally clears itself within seconds. If you are troubleshooting a “locked” environment in env zero and [.code]force-unlock[.code] does not seem relevant, this distinction is usually why.
Key takeaways
- [.code]terraform force-unlock LOCK_ID[.code] manually clears a stuck state lock. It does not touch your infrastructure, and on most backends it does not touch your state data either.
- Only use it when you are certain the process that created the lock is no longer running. Unlocking an active operation risks a corrupted state file.
- The lock ID is usually sitting right in the error message. You only need to hunt through backend-specific tooling when troubleshooting without that message in hand.
- S3 no longer needs DynamoDB for locking. [.code]use_lockfile = true[.code] has been the supported path since Terraform 1.11.
- [.code]-lock-timeout[.code] prevents most stuck-lock situations in CI before they happen, by waiting instead of failing immediately.
Frequently asked questions
Q. How do I fix a Terraform state lock?
Run [.code]terraform force-unlock LOCK_ID[.code], using the ID from the [.code]Error acquiring the state lock[.code] message. Only do this once you are certain no other operation is currently running against the same state.
Q. What is Terraform state locking for?
State locking prevents two operations from writing to the same state file at the same time, which is one of the most common causes of state corruption. Terraform acquires the lock automatically before any operation that could write state and releases it when the operation finishes.
Q. Can force-unlock corrupt my Terraform state?
[.code]force-unlock[.code] itself does not modify your infrastructure or your state data; it only removes the lock record. The risk is indirect: if you unlock a state that another process is actively writing to, that process and yours can both write at once, which can corrupt the state file.
Q. Does the S3 backend still need DynamoDB for state locking?
No. Since Terraform 1.11, the S3 backend supports native locking through [.code]use_lockfile = true[.code], using S3 conditional writes instead of a separate DynamoDB table. The older [.code]dynamodb_table[.code] argument still works but is deprecated.
Q. How do I avoid stuck state locks in the first place?
Avoid cancelling Terraform runs mid-operation, set [.code]-lock-timeout[.code] in CI so brief overlaps wait instead of failing, and use a platform that centralizes deployment history so you can quickly confirm whether a lock is stale before clearing it.
Terraform Force-Unlock: How to Safely Unlock a Locked State File

Hello, env zero fans! As some of you know, we have almost unlimited extensibility with 3rd party tools, using our custom workflows. You can hook in pretty much any tool, in any phase of the deployment. Today, we’re going to talk about how to prevent cloud misconfigurations before they start. We’re going to do this by chaining a tool in the deployment after the terraform plan phase. This is where our friends at Bridgecrew come in. Just like we at env zero have open-sourced the Terratag module of our platform, Bridgecrew has open-sourced Checkov!
Checkov
Checkov is a static code analysis tool for infrastructure-as-code. It scans cloud infrastructure managed in Terraform, Cloudformation, Kubernetes, Arm templates, or Serverless Framework and detects misconfigurations.

Setup
For illustration purposes, we’re going to use Bridgecrew’s demo application called TerraGoat. TerraGoat is Bridgecrew’s “Vulnerable by Design” Terraform repository. TerraGoat is a learning and training project that demonstrates how common configuration errors can find their way into production cloud environments.
DISCLAIMER: DO NOT ACTUALLY DEPLOY THIS APPLICATION INTO YOUR CLOUD INFRASTRUCTURE. IT IS PURPOSELY COMPROMISED.
I have created a template of TerraGoat inside of env zero and linked it to our Bridgecrew Demo project.

The only other thing we have to do is to actually call Checkov to do the check during the deployment. We need to do this after the Terraform plan phase, so that we have a plan to check. Here is what the env0.yml file will look like:
This adds 3 commands that run after the Terraform Plan, and before Terraform Apply. We put it here so that the Apply doesn’t run in case of failures. We don’t want to see the errors after the resources are applied. We want the deployment to fail if there are errors.
This command installs Checkov into our runtime environment using the pip3 package installer so we can run it against our Terraform plan.
This command essentially formats our .tf-plan file into tf.json so that it can be parsed and run against Checkov.
This command has a lot going on and is in 2 parts. First, it quietly executes Checkov against our tf.json (the reformatted tf.plan file) and looks for a 0 exit code. The double pipe || tells bash to only execute the 2nd command if the exit code of the first command is not 0. So if your Checkov results are clear, your deployment gets the 0 exit code and continues on with the deployment.
If not, then the second part of the command runs. Knowing if this part runs, it is because of a failure, we’re just going to format our error message here. We run Checkov again so we can pipe the error with the echoed error notification text to the console. The 1>&2 routs stdout to stderror, and the exit 1 code tells env zero that the stage failed, and to end the deployment run.

The env zero platform will parse the error, and give you the clear error printed on the Environment deployment page. But, if you want the full logs from Checkov, you can find those in the After: Terraform Plan deployment logs.

And that’s it! A little bit of YAML, and you’ve implemented Checkov to protect yourself against the deployment of misconfigured cloud resources. That is instantly added value to your organization by shifting the security left in your deployment process with env0.
You can find more information on Checkov here. You can find the open-source repository on GitHub. And be sure to see how you can automate your infrastructure security from commit to cloud at Bridgecrew.io.
Better Together: Checkov and env0


“All these investments in DevOps and developer productivity and operational efficiency are bottlenecking in these environments on security and compliance.”
This was an observation from Andrew Clay Shafer in a fireside chat with John Willis at DevOps Days Dallas 2022. One such bottleneck can come in the form of audit logs, but auditability doesn’t have to be a blocker.
In this post we’ll take a look at why auditing is necessary for Infrastructure as Code, the benefits of having an audit trail for Terraform and other IaC frameworks (such as Terragrunt, Pulumi, CloudFormation, Kubernetes, and others), and share how you can automate your audit trail easily with env0.
How do you audit Infrastructure as Code?
All you need is a central log management system that can aggregate and parse your audit. env zero delivers a number of benefits for auditability:
- Changes to infrastructure are tracked in the code repository, making it easy to see who made what changes and when.
- Automatically roll back changes that cause problems.
- Audit changes made by third-party vendors.
Audit log walkthrough
There are two ways to access audit logs in env0, 1) through the UI, and 2) through the API. As always, env zero gives you the flexibility to interact with your infrastructure-as-code as it suits your organization, be it programmatically or through a simple user interface. Only an Admin user can access the Audit Logs.
The audit log contains information about who performed the activity, when the action was performed, the activity’s description, and additional data like their IP address.
The audit log shows events related to changes in your:
- Organization
- Projects
- Templates
- Environments
- Teams
- Users
- Roles
- Modules
- Git Tokens
- Cloud credentials
- API keys
- SSH keys
- Variables
- Agent configurations
Through the env zero UI
- Go to the Organization's Settings page.
- Click the Audit Logs tab.
- The audit details are listed in a table.
- Click the row's + sign to reveal additional activity details.
- Click the Show more button at the bottom of the page to see more rows.

Through the env zero API
Use the "Fetch Audit Logs" API to retrieve your organization's audit logs programmatically. Learn more about the audit log in our documentation.
Use an audit log for governance and compliance
With this latest release, we’re continuing to deliver the enterprise-level capabilities to enable DevOps, Platform, and Infrastructure as Code teams to deliver secure software faster while ensuring compliance with internal policies or external regulations. env zero has clearly auditable versioning of infrastructure changes, giving you the answer to questions like, “What was changed, who changed it, and when was it changed?”
We help you avoid the audit and compliance bottleneck, so you can focus on what’s important—shipping software.
You Need Audit Logs for Your Infrastructure as Code, and They’re Easy to Set Up


In a recent blog post, I discussed expanding the idea of “Feature branches” to “Feature environments”. Using Infrastructure-as-Code, we can create an environment for every feature we are working on, thereby giving us a more flexible, isolated development environment, and allowing us to test our code early in the development process.
In this post I’d like to continue down that path, and see how we can automatically create an environment for every pull request, and gain a number of advantages over traditional static staging or qa environments.
Pull Requests & Moving Beyond Static Staging
Pull requests are a well known and common workflow step for many development teams. We usually think of them as a way you “tell others about changes you've pushed”, and where you “can discuss and review the potential changes with collaborators and add follow-up commits before your changes are merged”.
PR’s are more than just a code review - they’re a milestone in a feature’s lifecycle and a way of saying “I’m ready for this to be shared”. Beyond sharing it for feedback with the wider team, this milestone is a critical time to ensure it functions exactly as expected as part of the whole application, including any potential infrastructure or configuration changes. However - just as we wouldn’t want our data migration to run on the shared database at this point, we also want to use dedicated test infrastructure.

Static VS Dynamic PR Environments
At this point, you might ask yourself - I’m already testing my code and infrastructure changes in our dev/qa/staging environment, why complicate things?
Well, there are a number of advantages to moving from traditional, static environments, to dynamic, per-pull-request environments:
- They’re Isolated and Dedicated - having a dedicated environment for each PR means no more confusion of which version or branch is currently in staging, and no coordinating between people who want to test different versions.
- Easier To Share - Because each PR has its own fully functional environment, non technical stakeholders can provide feedback on new features very early in the process. Developers can then iterate over this feedback - without interfering with work being done by other team members.
- No Wasted Resources - Because you’re only provisioning an environment when you actually need it for testing, you’re not wasting (or paying for) resources when you don’t actually need them.
- Removes Bottlenecks In The Release Cycle - Shared development and staging environments are notorious bottlenecks for development teams, especially when they are the first place where new code meets infrastructure. It’s not uncommon to see a queue of who is using the environment for testing their features. Your developers time shouldn’t be spent on waiting.
How Do You Actually Do It?
Ok, so “per pull request environments” is an awesome idea. How are we going to actually get there? There are a number of tools out there that can help you accomplish this task but in this post, I’ll be using env0, a first of it’s kind environment-as-a-service platform - not just to deploy the environments, but to manage them as well.
Your default assumption might be to just use your CI/CD platform to set up your environment. This works, but most CI/CD platforms are built for running short lived tasks, whereas an environment’s lifecycle extends beyond deploying it once: It needs to be updated, monitored, and in the end destroyed. Besides easily automating resource provisioning using Terraform, env zero will help me keep track of which environments are up, which ones have had issues, and will provide me a top level view of how my whole team is using these environments.
Besides env0, I’ll be using Github to host my code and open pull requests, and Github Actions to trigger my environment creation. I’ll be using the same code example from the previous post, which will be deployed on AWS.
If you’d like to try this out yourself, the prerequisites for this tutorial will be
- An env zero account (it’s free, just login)
- A Github account
- An AWS account

Getting Our Hands Dirty
Step one to fully automating anything is to make sure we can run it manually, so you’ll want to get your system set up. In my case, I’ve followed env0’s getting started guide, and taken the key steps of creating my own organization, connecting my AWS account, and creating a template for my Terraform code.
Custom workflows to the rescue
In the example code I’ve used, I also ran a bash script before deploying the environment. We can easily make sure this code runs before our Terraform is applied, using env0’s Custom Flows feature. I’ve already done this in advance and I’ve put my code in the env0.yml file, in our Github repo.
Let ‘er Rip!
We are ready to launch our first environment! Remember - this is just a manual test, to see things are ready for automation.
In the case of env0, just go to your Project Templates pages, and click “Run now” on the template we’ve created before. In the next screen, you can validate your settings, and when you’re ready - click “Run”.

Great!
Integrating into CI/CD
Now that we know our environment management system will properly configure our environments, we need to make it run each time we open a pull request. For that, we’ll be using Github Actions to trigger env0’s CLI.
In order to create an environment on env zero from Github Actions, we need to create an API key for env0.
Next, we’ll need to save the API key and secret as Github Secrets, in the same manner we saved our AWS credentials to env0.

The final step of connecting everything, is telling Github how to trigger our environment deploy. We’ll add the following code to our codebase, in the file `.github/workflows/pr-environments.yml`.
name: "PR Environments"
on:
pull_request:
types: [opened, closed, reopened, synchronize]
jobs:
env0_pr_environment:
name: "PR Environment"
runs-on: ubuntu-16.04
env:
ACTION: deploy
steps:
- name: Set Action
if: github.event.action == 'closed'
run: echo "::set-env name=ACTION::destroy"
- uses: actions/setup-node@v1
with:
node-version: '12'
- uses: actions/checkout@v2
with:
repository: env0/env0-client-integrations
- name: install
working-directory: node
run: yarn
- name: deploy
working-directory: node
run: >
node env0-deploy-cli.js
--apiKey ${{ secrets.ENV0_API_KEY_ID }}
--apiSecret ${{ secrets.ENV0_API_KEY_SECRET }}
--action $ACTION
--organizationId ${{ secrets.ENV0_ORG_ID }}
--projectId ${{ secrets.ENV0_PROJECT_ID }}
--blueprintId ${{ secrets.ENV0_BLUEPRINT_ID }}
--environmentName "${{ github.head_ref }}"
--revision "${{ github.head_ref }}"
In the code above, you can see we
- Determine the action depending on the Github event data
- Fetch the env zero CLI, using the `checkout` action
- Run the env zero cli to deploy, update, or destroy the environment
- The name of the environment will be the branch name
That’s all folks!
We now have a fully functioning pipeline, and our setup will automatically create a new environment for every PR we open! When we deploy a new feature, even if that feature requires new or different infrastructure, the changes in our Terraform code will automatically be reflected in the resources provisioned for the PR environment!


In the case of env0, even though environments will be automatically created and destroyed by our CI/CD integration, we can also use the env zero UI as a control plane, for understanding which environments are up, and what they consist of. You can also use env0’s cost monitoring features, to understand how much each of these environments actually costs.

Thank you for taking the time to read this post, I hope it helps you setting an environment-per-PR pipeline for your team. Once you’ve tried it yourself, I’d love to hear about it! Let me know in the comments below or on Twitter at @envzero.
Why You Should Be Using Per-Pull Request Environments (and how!)


In this guide, we will be exploring three IaC scanning tools, Checkov, tfsec, and Terrascan. We will go into detail of each tool, as well as compare the features of all three. You can explore the other parts of this guide below.
Jump to section:
Checkov vs tfsec vs Terrascan: Which IaC Scanning Tool is the Best?
Infrastructure as Code (IaC) is a popular approach to automate the provisioning and management of cloud computing resources using declarative configuration files. However, IaC also introduces new security challenges and risks that need to be addressed before deploying to production. In this blog post, we will compare three popular IaC scan tools: Checkov, tfsec, and Terrascan. These tools can help you identify and fix security issues in your IaC code before they become vulnerabilities in your cloud environment. We will compare them based on their features, performance, usability, and compatibility with different IaC frameworks and cloud providers.
Comparing IaC Scan Tools: Video walkthrough
Our setup
Let’s take a look at our setup.
Requirements
- A GitHub account (all the hands-on sections will utilize GitHub’s Codespaces so you won’t need to install anything on your machine)
Repository
TL;DR: You can find the repo here.
What is an IaC scan tool and what is it used for?
Alright, before we dig in, let’s get an understanding of a few concepts.
An IaC scan tool is a software application that analyzes your IaC files and detects security vulnerabilities, misconfigurations, compliance violations and other issues. IaC scan tools improve the quality and security of IaC files before they are deployed to cloud environments. These tools can help developers, DevSecOps and DevOps teams identify and fix potential problems in their code early in the development lifecycle, reducing the risk of potential data breaches, data leaks, downtime and other incidents.
What is Static Code Analysis?
Static code analysis is a method that examines the source code of a program without running it. Static code analysis tools can automate this process and detect possible errors, security vulnerabilities, and code quality issues. Static code analysis can help developers find and fix problems early in the development cycle, before they become more costly and difficult to resolve. Static code analysis can also help ensure that the code meets certain standards and guidelines, for such issues as coding style, performance, or compliance.
How does IaC scanning work?
IaC scanning works by applying a set of rules or policies to the IaC configuration files that check for common security best practices, such as encryption, authentication, authorization, logging, and monitoring. The rules or policies can be based on industry standards, such as CIS benchmarks, or customized to fit the specific needs of the organization. The IaC scanning tools can then generate a report that shows the results of the analysis, such as the number and severity of vulnerabilities found, the location of the vulnerable code, and the recommended remediation steps. The scan report itself can also be integrated with other tools, such as GitLab or GitHub, to provide feedback and guidance to developers in their workflows.
Why do you need IaC security scanning?
Imagine you are building a house and you have a blueprint that shows how everything should look and work. You wouldn't want to start construction without checking the blueprint for errors, right? You might end up with a leaky roof, a crooked wall, or faulty wiring. That's why you need IaC security scanning. It helps you find and fix any issues in your infrastructure as code before you deploy it to the cloud. It's like having a quality assurance team for your blueprint. IaC security scanning can save you time, money, and headaches in the long run.
Which IaC scanning tools exist?
Some of the most popular IaC scanning tools are checkov, tfsec, and terrascan. These tools can help you identify common vulnerabilities and best practices in your IaC code, such as Terraform, CloudFormation, Kubernetes, and more. However, they are not perfect and they may have some limitations or false positives. Here is a brief comparison of these three tools and later we will dig deeper into each one.
- Checkov: A comprehensive tool that supports Terraform, CloudFormation, Kubernetes, Helm, Serverless Framework, and more. It has a rich set of features and integrations, such as pre-commit hooks, GitHub actions, VS Code extension, etc. However, it may be slower and more complex than other tools.
- tfsec: A fast and lightweight tool that supports Terrafor. It has a simple installation process and a nice output format. However, it may not cover all the resources or scenarios that you need.
- Terrascan: A modular tool that supports Terraform, Kubernetes, Helm, Dockerfiles, and more. It has a flexible architecture that allows you to write your own policies using Open Policy Agent (OPA). However, it may have a steeper learning curve and less documentation than other tools.
As you can see, there is no one-size-fits-all solution for IaC scanning. You may need to try different tools and see which one works best for your use case. Or you may need to use a combination of tools to achieve the best results. The important thing is to scan your IaC code regularly and fix any issues that you find before they become a problem.
Which IaC Scanning Tool is the Best?: Comparing Checkov vs tfsec vs Terrascan

.avif)