Welcome to the 3rd episode! Today we are going to talk about some upcoming events for env0, and get into an interview with Sean O'Dell. Sean is the Director of Developer Advocacy at Accurics. They are a partner technology company that created and maintain the Terrascan OSS project. Using this with env zero allows you to shift security left in the deployment process, and enable the ability to stop insecure deployments before they start.
Related Content
Cost visibility without governance is just expensive awareness. Governance without real-time data is just expensive guessing.
The Infracost team published something worth reading: a breakdown of the ten cloud cost anti-patterns that quietly drain infrastructure budgets. These include old EC2 instance families, orphaned test environments, log groups retaining data forever, and multi-AZ replication running in dev because someone copy-pasted a prod config.
Their diagnosis is correct. These aren't careless mistakes. They're reasonable decisions made without cost context at the moment those decisions happen.
But the billing console only tells you what already happened. And a PR-level cost estimate only tells you what's about to happen. Neither one tells you what your infrastructure is costing you right now, across every environment, every team, every account.
That's three separate problems. They need three separate capabilities… working together.
The Three Moments That Matter
Cloud cost control has a timeline, but most teams only address one part of it.
Before deployment: An engineer writes a Terraform module. They pick an instance type, configure a database, set retention policies. Every decision they make has a cost implication. Without visibility at this stage, those implications are invisible until the bill arrives.
At deployment: Code merges. Infrastructure provisions. Policies either enforce standards or they don't. This is the last moment a cost problem is cheap to fix.
After deployment: The environment is live and then configurations drift. New services get adopted without a clear cost model, while test environments survive longer than they should. Costs accumulate quietly, outside any PR, outside any policy review.
Most teams have partial coverage at best. Infracost handles the first moment. env zero handles the second. CloudQuery—now part of env zero—handles the third.
Before You Ship: Infracost + env zero
Infracost surfaces cost estimates in pull requests (and they support more than 10 million SKUs across clouds). An engineer sees that the RDS instance is over-provisioned for a dev workload. They see the monthly delta. The context is there, at the exact moment the fix is a two-minute edit rather than a production change requiring a maintenance window.
env zero extends that context into enforcement. A cost threshold policy blocks the deployment if the estimated spend exceeds a defined limit. A tagging policy requires every environment to carry an owner tag and an expiry date before it merges. A governance workflow routes high-cost changes to a reviewer with authority to approve or reject.
The engineer isn't the last line of defense anymore; the platform is.
Customers using env zero's pre-deployment cost enforcement have cut IaC-related infrastructure spend by 45%. That's not optimization after the fact; that's the problem not happening.
After You Ship: env zero + CloudQuery
Pre-deployment governance catches what you can see before the merge. It doesn't catch what changes after it.
Infrastructure drifts. Engineers provision resources outside the standard pipeline. A test environment spun up six months ago never got an expiry date. A new managed service got adopted without anyone mapping out what it costs at scale. These problems live in your running infrastructure, not in your pull requests.
CloudQuery is now part of env zero. It continuously queries your live cloud infrastructure—across AWS, Azure, and GCP—and surfaces what's actually running, what it's actually costing, and where it deviates from the standards your platform team has defined.
This is the real-time half of cloud cost governance. Not what an engineer estimated before the merge. What your infrastructure is actually spending right now.
The Test Environment Problem, Fully Solved
The Infracost piece calls out the test environment that never got torn down. Every platform engineer has several of these.
env zero handles this at the policy level before deployment: every environment carries a TTL, auto-expiry terminates it on schedule, no engineer has to remember anything.
CloudQuery handles the environments that already exist without those controls. It finds them. It surfaces their running cost. It gives your platform team the data to act on.
Virgin Media O2 went from spending half a day standing up a single POC environment to spinning one up in under 10 minutes with 5 variables. Auto-expiry controls costs automatically. CloudQuery makes sure nothing slips through the cracks of what's already running.
Governance Across the Full Infrastructure Lifecycle
The common thread in every cloud cost anti-pattern Infracost identified: engineers made reasonable decisions without the right context at the right moment.
The fix isn't better finance reviews after the fact, but rather, closing all three gaps before deployment, at deployment, and in production.
Infracost provides cost context in the PR. env zero enforces the policies that make that context binding. CloudQuery, now part of env zero, continuously monitors what's running and surfaces what the enforcement layer didn't catch.
That's not three tools. That's one governance lifecycle from the first line of Terraform to the last running resource.
See how env zero governs the full infrastructure lifecycle →
Learn more about the env zero Infracost integration →
Related: env0’s AWS integration brings environment management, cost controls, and deployment guardrails to your AWS infrastructure workflows.
The Full Picture of Cloud Cost Control: How Infracost, env zero, and CloudQuery Close the Loop for Platform Teams


Hello, env zero fans! As some of you know, we have almost unlimited extensibility with 3rd party tools, using our custom workflows. You can hook in pretty much any tool, in any phase of the deployment. Today, we’re going to talk about how to prevent cloud misconfigurations before they start. We’re going to do this by chaining a tool in the deployment after the terraform plan phase. This is where our friends at Bridgecrew come in. Just like we at env zero have open-sourced the Terratag module of our platform, Bridgecrew has open-sourced Checkov!
Checkov
Checkov is a static code analysis tool for infrastructure-as-code. It scans cloud infrastructure managed in Terraform, Cloudformation, Kubernetes, Arm templates, or Serverless Framework and detects misconfigurations.

Setup
For illustration purposes, we’re going to use Bridgecrew’s demo application called TerraGoat. TerraGoat is Bridgecrew’s “Vulnerable by Design” Terraform repository. TerraGoat is a learning and training project that demonstrates how common configuration errors can find their way into production cloud environments.
DISCLAIMER: DO NOT ACTUALLY DEPLOY THIS APPLICATION INTO YOUR CLOUD INFRASTRUCTURE. IT IS PURPOSELY COMPROMISED.
I have created a template of TerraGoat inside of env zero and linked it to our Bridgecrew Demo project.

The only other thing we have to do is to actually call Checkov to do the check during the deployment. We need to do this after the Terraform plan phase, so that we have a plan to check. Here is what the env0.yml file will look like:
This adds 3 commands that run after the Terraform Plan, and before Terraform Apply. We put it here so that the Apply doesn’t run in case of failures. We don’t want to see the errors after the resources are applied. We want the deployment to fail if there are errors.
This command installs Checkov into our runtime environment using the pip3 package installer so we can run it against our Terraform plan.
This command essentially formats our .tf-plan file into tf.json so that it can be parsed and run against Checkov.
This command has a lot going on and is in 2 parts. First, it quietly executes Checkov against our tf.json (the reformatted tf.plan file) and looks for a 0 exit code. The double pipe || tells bash to only execute the 2nd command if the exit code of the first command is not 0. So if your Checkov results are clear, your deployment gets the 0 exit code and continues on with the deployment.
If not, then the second part of the command runs. Knowing if this part runs, it is because of a failure, we’re just going to format our error message here. We run Checkov again so we can pipe the error with the echoed error notification text to the console. The 1>&2 routs stdout to stderror, and the exit 1 code tells env zero that the stage failed, and to end the deployment run.

The env zero platform will parse the error, and give you the clear error printed on the Environment deployment page. But, if you want the full logs from Checkov, you can find those in the After: Terraform Plan deployment logs.

And that’s it! A little bit of YAML, and you’ve implemented Checkov to protect yourself against the deployment of misconfigured cloud resources. That is instantly added value to your organization by shifting the security left in your deployment process with env0.
You can find more information on Checkov here. You can find the open-source repository on GitHub. And be sure to see how you can automate your infrastructure security from commit to cloud at Bridgecrew.io.
Better Together: Checkov and env0


This quick video talks about the static code analysis tool, Checkov by Bridgecrew. We'll use it to fix a problem with a Terraform deployment into Azure. Be sure to star their repository if you like the project.
Checkov, Analysis Tool by Bridgecrew and env0


In recent years, Infrastructure as Code (IaC) has become an increasingly popular approach for managing cloud-based infrastructure with tools such as Terraform, AWS CloudFormation, and Pulumi.
Those tools allow developers to define infrastructure resources using code that enables them to use all the capabilities of code, such as versioning, automation deployment, and policies. However, with the growing complexity of cloud architecture, it is challenging to monitor and debug issues in real-time, such as CPU spikes or number of requests.
Observability is the ability to understand how a system behaves internally based on its external outputs. In other words, it's the practice of instrumenting a system to expose its internal state in a way that is observable and understandable. Observability is essential for any system to detect and resolve issues quickly, where downtime can be costly.
For example, you've defined your infrastructure resources and deployed them using a tool like Terraform. Terraform will let you know all resources have been deployed successfully, but there are no checks to validate the health of those resources over time.
If, after time, you notice that the application response time is increasing, and customers are complaining about slow performance and bad user experience. With an observability tool, you can quickly identify the issue by inspecting application logs and traces and correlating them to your infrastructure changes.
You may discover that one of the infrastructure resources, such as a load balancer, some of the virtual machines, or your application’s database is not scaling properly, leading to increased response time. By identifying the issue quickly, you can adjust the IaC code to make changes to the infrastructure resources and redeploy the resources with minimal downtime.
Using a full-stack observability platform with IaC provides several benefits.
- It enables teams to detect and resolve issues quickly, reducing the impact on customers and the company.
- It provides a holistic view of the system, enabling teams to monitor both application and infrastructure metrics in one place and understand the system in an end-to-end manner.
- And, it allows teams to make data-driven decisions when optimizing infrastructure resources, leading to better performance and cost savings.
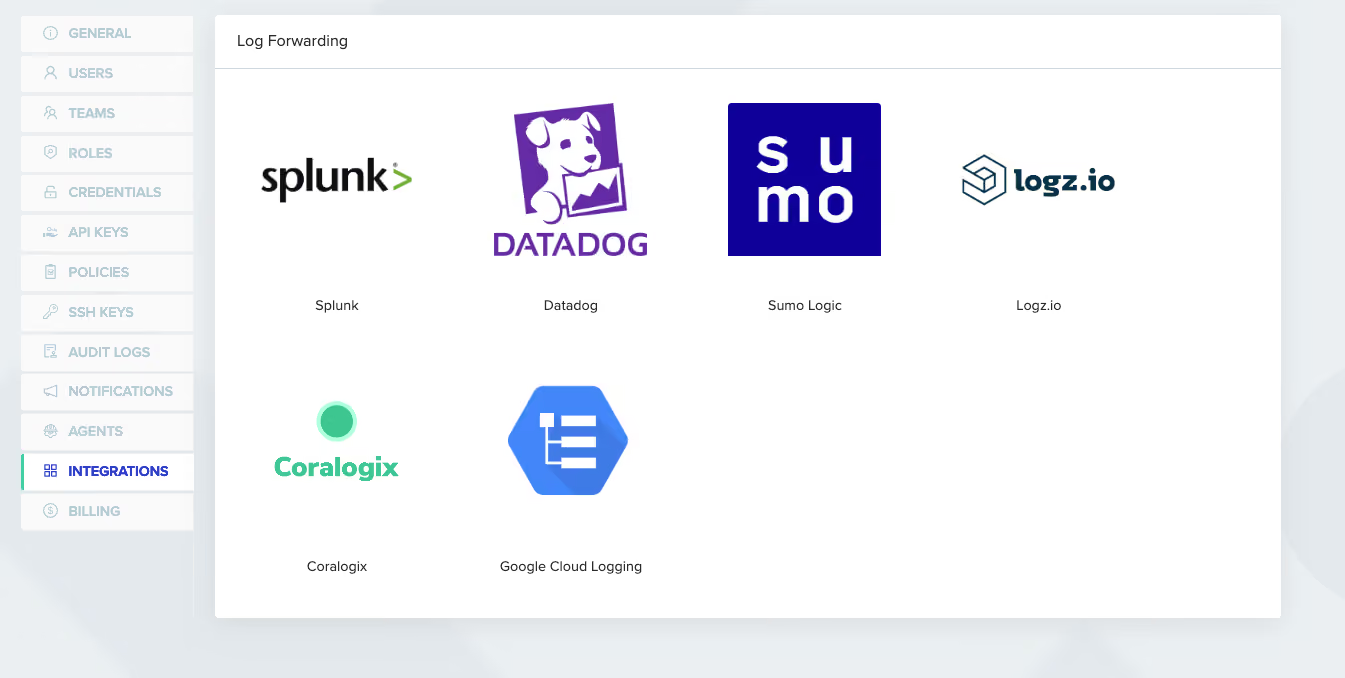
With env0, you can forward all env zero deployment logs to one of the supported observability platforms by going to the organization settings -> Integration -> Log Forwarding and selecting the relevant platform you are using. Doing so will allow the platform to collect logs and data from env0, and you can immediately get to observing what’s really happening under the covers of your deployed application.

In conclusion, using an observability product with IaC is essential for teams managing cloud-based infrastructure. It provides critical monitoring, tracing, and logging capabilities, enabling teams to detect and resolve issues quickly. With the growing complexity of cloud architecture, observability is becoming increasingly important, and using a product that can provide a holistic view of the system is key to optimizing performance and minimizing downtime.
Why Observability tools are important when using IaC


In this guide, we will be exploring three IaC scanning tools, Checkov, tfsec, and Terrascan. We will go into detail of each tool, as well as compare the features of all three. You can explore the other parts of this guide below.
Jump to section:
Checkov vs tfsec vs Terrascan: Which IaC Scanning Tool is the Best?
Infrastructure as Code (IaC) is a popular approach to automate the provisioning and management of cloud computing resources using declarative configuration files. However, IaC also introduces new security challenges and risks that need to be addressed before deploying to production. In this blog post, we will compare three popular IaC scan tools: Checkov, tfsec, and Terrascan. These tools can help you identify and fix security issues in your IaC code before they become vulnerabilities in your cloud environment. We will compare them based on their features, performance, usability, and compatibility with different IaC frameworks and cloud providers.
Comparing IaC Scan Tools: Video walkthrough
Our setup
Let’s take a look at our setup.
Requirements
- A GitHub account (all the hands-on sections will utilize GitHub’s Codespaces so you won’t need to install anything on your machine)
Repository
TL;DR: You can find the repo here.
What is an IaC scan tool and what is it used for?
Alright, before we dig in, let’s get an understanding of a few concepts.
An IaC scan tool is a software application that analyzes your IaC files and detects security vulnerabilities, misconfigurations, compliance violations and other issues. IaC scan tools improve the quality and security of IaC files before they are deployed to cloud environments. These tools can help developers, DevSecOps and DevOps teams identify and fix potential problems in their code early in the development lifecycle, reducing the risk of potential data breaches, data leaks, downtime and other incidents.
What is Static Code Analysis?
Static code analysis is a method that examines the source code of a program without running it. Static code analysis tools can automate this process and detect possible errors, security vulnerabilities, and code quality issues. Static code analysis can help developers find and fix problems early in the development cycle, before they become more costly and difficult to resolve. Static code analysis can also help ensure that the code meets certain standards and guidelines, for such issues as coding style, performance, or compliance.
How does IaC scanning work?
IaC scanning works by applying a set of rules or policies to the IaC configuration files that check for common security best practices, such as encryption, authentication, authorization, logging, and monitoring. The rules or policies can be based on industry standards, such as CIS benchmarks, or customized to fit the specific needs of the organization. The IaC scanning tools can then generate a report that shows the results of the analysis, such as the number and severity of vulnerabilities found, the location of the vulnerable code, and the recommended remediation steps. The scan report itself can also be integrated with other tools, such as GitLab or GitHub, to provide feedback and guidance to developers in their workflows.
Why do you need IaC security scanning?
Imagine you are building a house and you have a blueprint that shows how everything should look and work. You wouldn't want to start construction without checking the blueprint for errors, right? You might end up with a leaky roof, a crooked wall, or faulty wiring. That's why you need IaC security scanning. It helps you find and fix any issues in your infrastructure as code before you deploy it to the cloud. It's like having a quality assurance team for your blueprint. IaC security scanning can save you time, money, and headaches in the long run.
Which IaC scanning tools exist?
Some of the most popular IaC scanning tools are checkov, tfsec, and terrascan. These tools can help you identify common vulnerabilities and best practices in your IaC code, such as Terraform, CloudFormation, Kubernetes, and more. However, they are not perfect and they may have some limitations or false positives. Here is a brief comparison of these three tools and later we will dig deeper into each one.
- Checkov: A comprehensive tool that supports Terraform, CloudFormation, Kubernetes, Helm, Serverless Framework, and more. It has a rich set of features and integrations, such as pre-commit hooks, GitHub actions, VS Code extension, etc. However, it may be slower and more complex than other tools.
- tfsec: A fast and lightweight tool that supports Terrafor. It has a simple installation process and a nice output format. However, it may not cover all the resources or scenarios that you need.
- Terrascan: A modular tool that supports Terraform, Kubernetes, Helm, Dockerfiles, and more. It has a flexible architecture that allows you to write your own policies using Open Policy Agent (OPA). However, it may have a steeper learning curve and less documentation than other tools.
As you can see, there is no one-size-fits-all solution for IaC scanning. You may need to try different tools and see which one works best for your use case. Or you may need to use a combination of tools to achieve the best results. The important thing is to scan your IaC code regularly and fix any issues that you find before they become a problem.
Which IaC Scanning Tool is the Best?: Comparing Checkov vs tfsec vs Terrascan


In this section of the IaC Scanning Tools Guide, we will be looking at tfsec and discussing the benefits, key features, and looking at some real world examples. You can explore the other parts of this guide below.
Jump to section:
- What is an IaC scan tool?
- What is Checkov?
- What is Terrascan?
- Comparing Checkov vs. tfsec vs. Terrascan
What is tfsec?
tfsec is a security scanner for your Terraform code. It performs static analysis of your code and detects potential misconfigurations that could lead to security risks. It supports multiple cloud providers, such as AWS, Azure, and GCP, and has hundreds of built-in rules. It also allows you to define your own custom rules using Rego policies or JSON/YAML custom policies. You can run tfsec locally or in your CI pipelines, and get developer-friendly output in various formats. tfsec is an open-source project backed by Aqua Security that aims to help you secure code in your IaC.
Benefits and Key Features of using tfsec
Some benefits and key features of using tfsec are:
| Feature | Details |
|---|---|
| Scanning IaC | Yes for security and compliance before deployment |
| IaC Frameworks Supported | Only Terraform |
| Reporting | Detailed reports and recommendations for fixing the detected issues in different formats such as text, JSON, CSV, Checkstyle, JUnit, and SARIF. |
| Integrations | Many tools including GitHub Actions, GitLab CI, and VS Code |
| Policy Customizations | Yes using JSON or YAML |
| Open-source | Yes |
| Example of Issues that can be detected | Insecure use of plain text secrets or hard-coded credentials Misconfigured network access rules or firewall settings Unencrypted data storage or communication Missing or outdated security features or patches Non-compliance with industry standards or regulations |
How to get started with tfsec
How to install tfsec?
There are several ways to install tfsec on your system. You can use a package manager such as brew (for macOS or Linux), choco (for Windows), or scoop (for Windows). You can also download the binary for your system from the releases page on GitHub. Alternatively, you can install tfsec with Go using the command:
go install github.com/aquasecurity/tfsec/cmd/tfsec@latest
If you don't want to install tfsec on your system, you can also run it in a Docker container using the command:
docker run --rm -it -v "$(pwd):/src" aquasec/tfsec /src
If you follow along with our GitHub repo using Codespaces, it will be installed for you.
How to use tfsec?
To use tfsec, you simply need to run it on a directory that contains your Terraform code. For example:
tfsec ./Terraform
By default, tfsec will use a lovely output format that shows the severity, description, location, and resolution of each problem. You can change the output format using the --format flag.
For example:
tfsec ./Terraform --format json
This will output the results in JSON format. You can also use other formats such as csv, checkstyle, junit, sarif, text, markdown, html, and gif.
You can also customize the behavior of tfsec using various flags or a configuration file. For example, you can exclude certain checks using the --exclude flag. You can also enable or disable colors, force exit codes, ignore warnings or errors, set custom paths for modules or policies, and more. For a full list of flags you can run tfsec -h
Example use cases of tfsec
Use case 1: Scan your Terraform code for security issues before applying it
One of the most common use cases of tfsec is to scan your Terraform code for security issues before applying it to your cloud environment. This way, you can catch and fix any problems before they cause any damage or expose any vulnerabilities.
Let’s scan the same folder we scanned with checkov. Run the following commands:
tfsec ./Terraform
This will scan all the Terraform files in the current directory and print out a report of any issues found. For example:


As you can see, tfsec provides a clear and concise output that shows the location, severity, and description of each issue. It also provides a link to the documentation page where you can learn more about the issue and how to fix it.
Use case 2: Scan your Kubernetes manifests
Unfortunately, tfsec does not support scanning Kubernetes manifests. It was built specifically to scan Terraform files.
tfsec Custom Policies
Similar to checkov, you can create custom checks in tfsec either using YAML or JSON or using Rego. Let’s create a check similar to the one we did with checkov. We shouldn’t allow an S3 bucket’s ACL to be public-read when it is tagged with the key Scope and the value of PCI.
Custom checks are defined as JSON files or YAML files which sit in the .tfsec folder in the root check path. Any file with the suffix tfchecks.json or tfchecks.yaml will be parsed and the checks included during the run.
Check the pci_policy_tfchecks.yaml in the .tfsec folder in our repo. Below is the content:
---
checks:
- code: CUS999
description: Make sure S3 bucket ACL is NOT public-read if it has a Scope=PCI tag
impact: We would violate our PCI compliance
resolution: Make sure the ACL is not public-read
requiredTypes:
- resource
requiredLabels:
- aws_s3_bucket
severity: CRITICAL
matchSpec:
action : or
predicateMatchSpec :
- action : notContains
name : tags
value:
Scope: "PCI"
- action : notContains
name : acl
value: public
errorMessage: S3 bucket ACL is public-read with Scope=PCI tag
relatedLinks:
- http://internal.acmecorp.com/standards/aws/tagging.html
Use the normal command to run:
tfsec ./Terraform
And examine the output:

What is tfsec: Benefits, Key Features, and Examples